
When the water is too murky to see, sonar can still measure what is inside the pipe.
A major city council needed to know how much sediment had built up inside a large stormwater outfall pipeline in Brisbane. We were asked to measure it. Across two site visits in May 2021, AUS-ROV sent a custom-configured inspection ROV along roughly 190 m of the pipeline, capturing sonar profiles that turned a murky, hidden problem into quantifiable numbers.
The Challenge
Stormwater outfalls collect silt over time, and in a tidal setting the sediment is pushed around by both stormwater inflows and the tide. Too much of it reduces the pipe's capacity to carry water. To plan clean-out work sensibly, the owner needed to know where the sediment was, how deep it was, and how much of it there was.
The difficulty was visibility. The water inside the pipeline was extremely murky, so cameras alone could see very little below the waterline, and the pipe had to be assessed without anyone entering it.
Our Approach
We split the pipeline into three stages so the survey could be planned, run and checked section by section: from a grated inlet dome down to a backflow chamber, upstream of the dome, and from the backflow chamber to the outlet structure.
Our ROV was deployed through the grated dome inlet and the backflow chamber and piloted remotely along each stage, so no one needed to enter the pipe. Sonar works regardless of how cloudy the water is, which allowed us to capture the internal shape of the pipe and the sediment bed along its length. Where the water level left an air gap at the top of the pipe, we also recorded high-definition video of the pipe crown for a limited visual check of the walls above the waterline.
Outcomes and Deliverables
The survey profiled approximately 190 m of the pipeline and measured about 255 cubic metres of sediment in total. Key findings included:
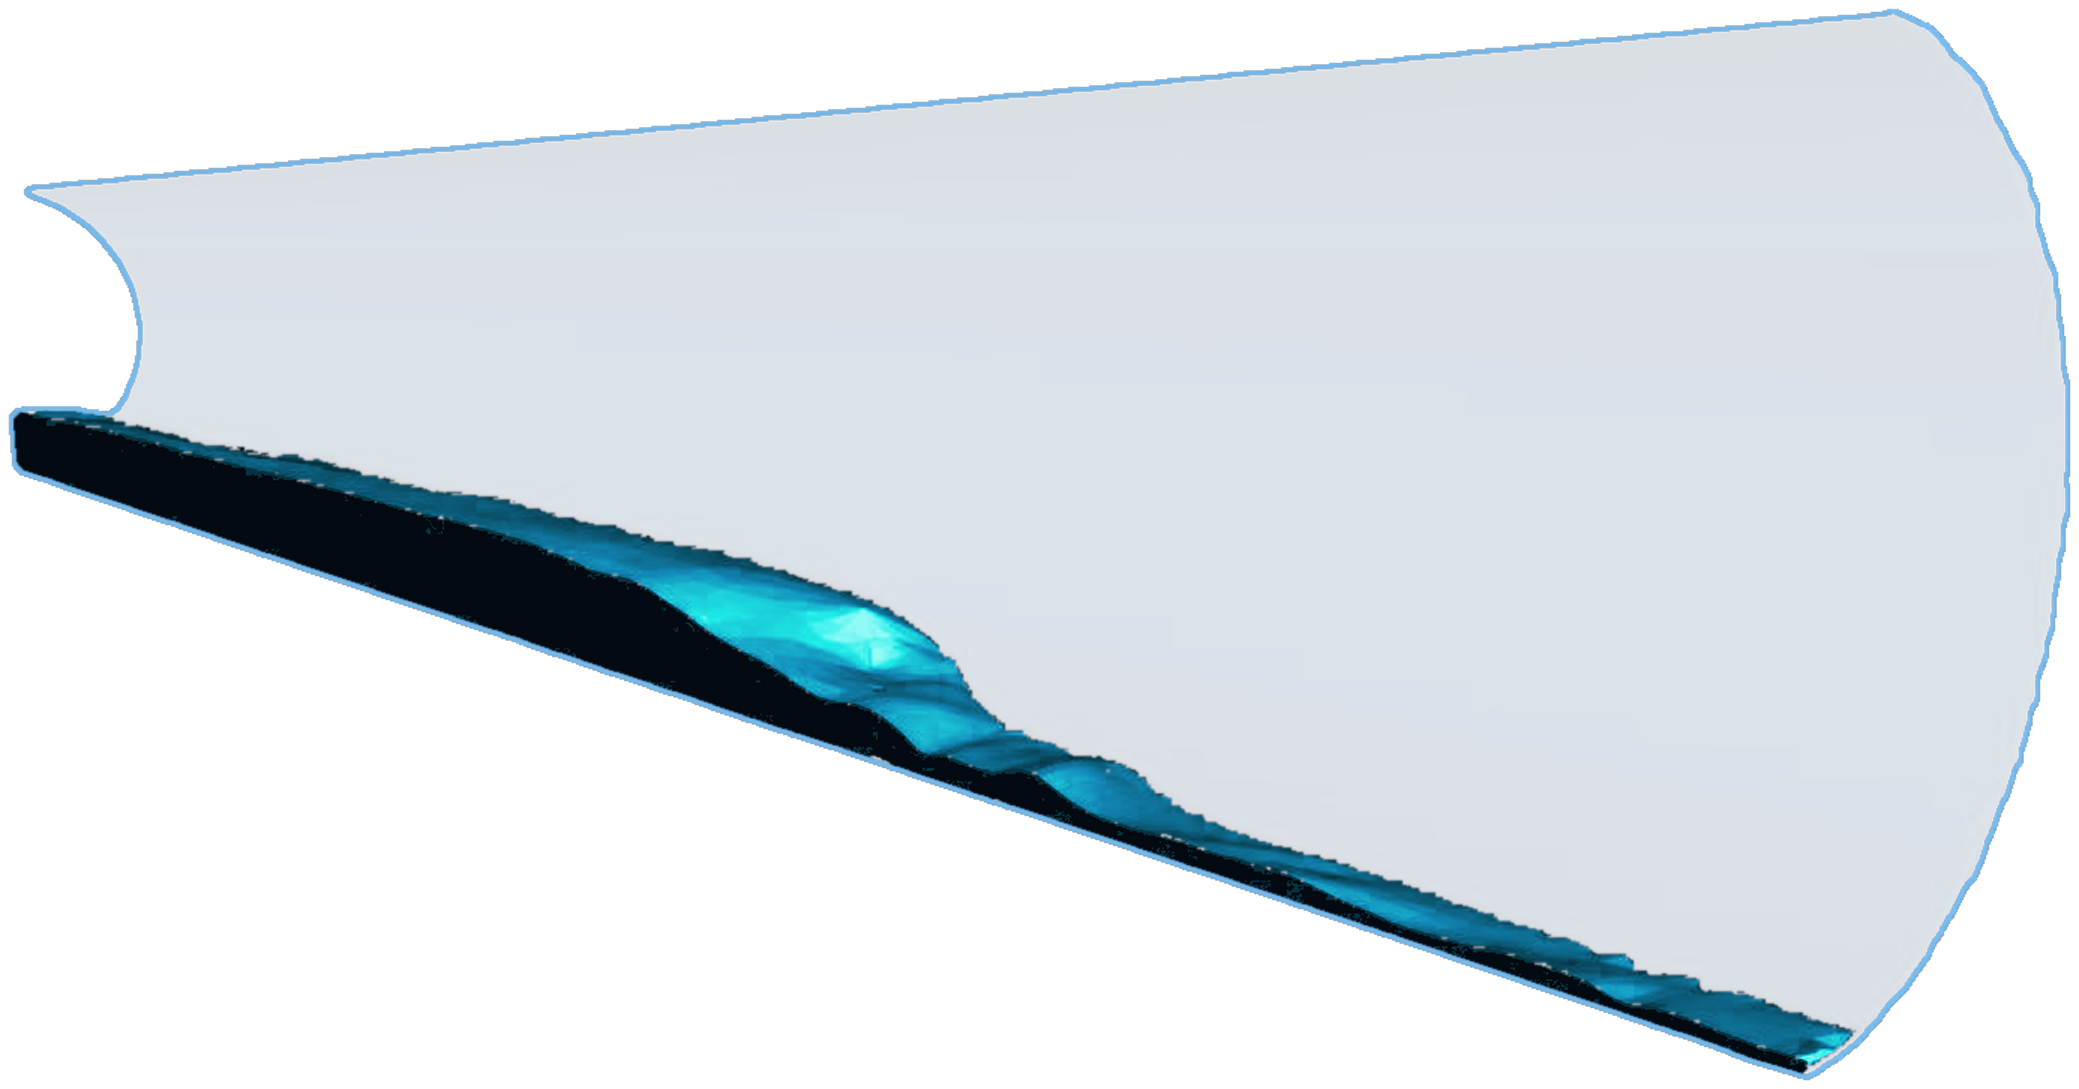
Sediment volume was highest in the stretch between the backflow chamber and the outlet, at roughly 1.8 cubic metres per metre of pipe.
Volume reduced progressively in an upstream direction, with a more consistent, continuous bed upstream of the inlet dome.
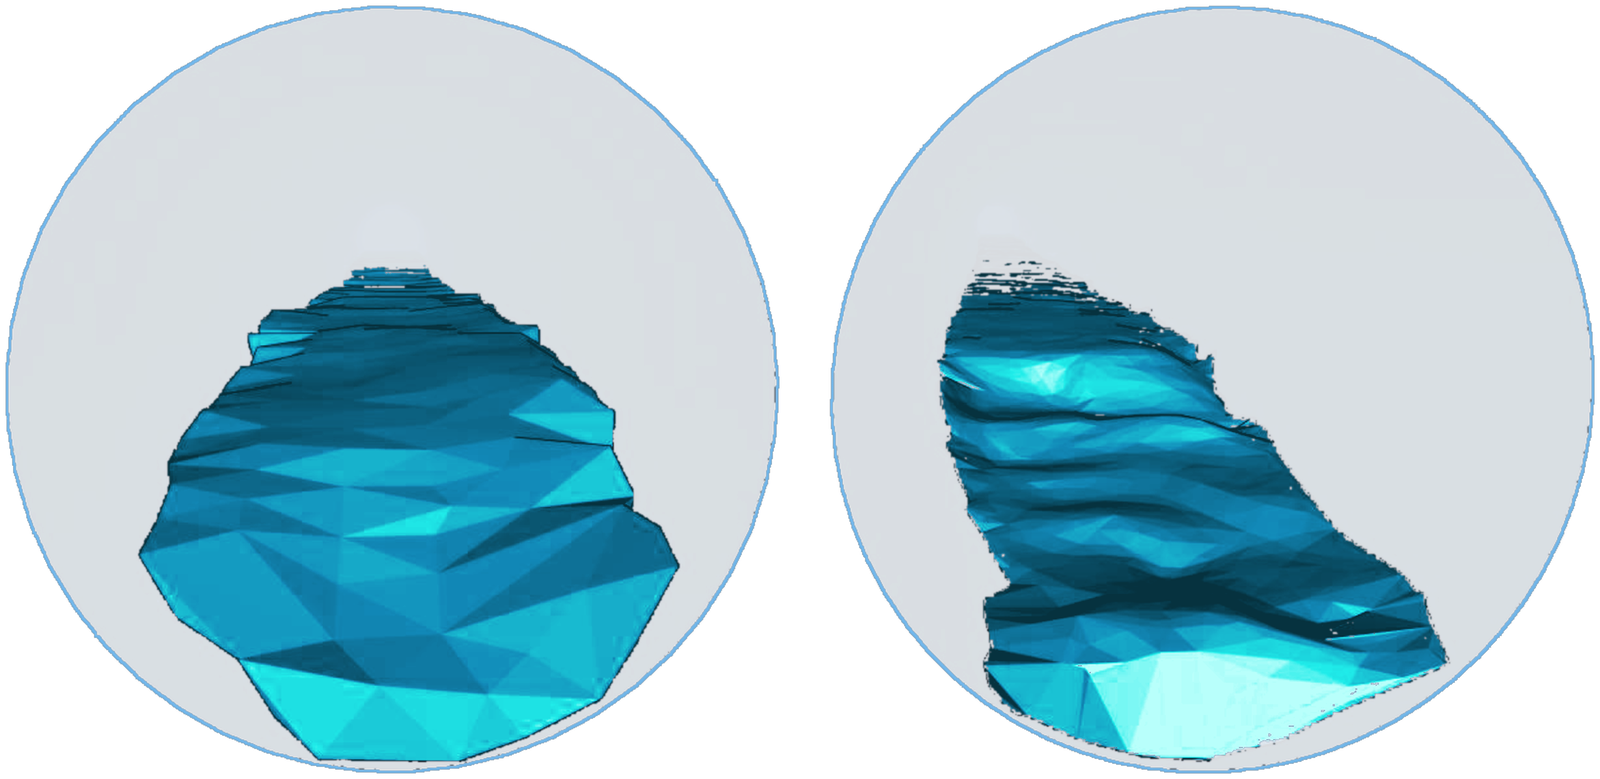
Between the backflow chamber and the outlet, sediment depth was fairly even, with local mounding typical of material being worked and moved by the tide and stormwater flows.
No scour patterns were seen, suggesting the pipeline had not recently been flushed by a high-intensity rain event.
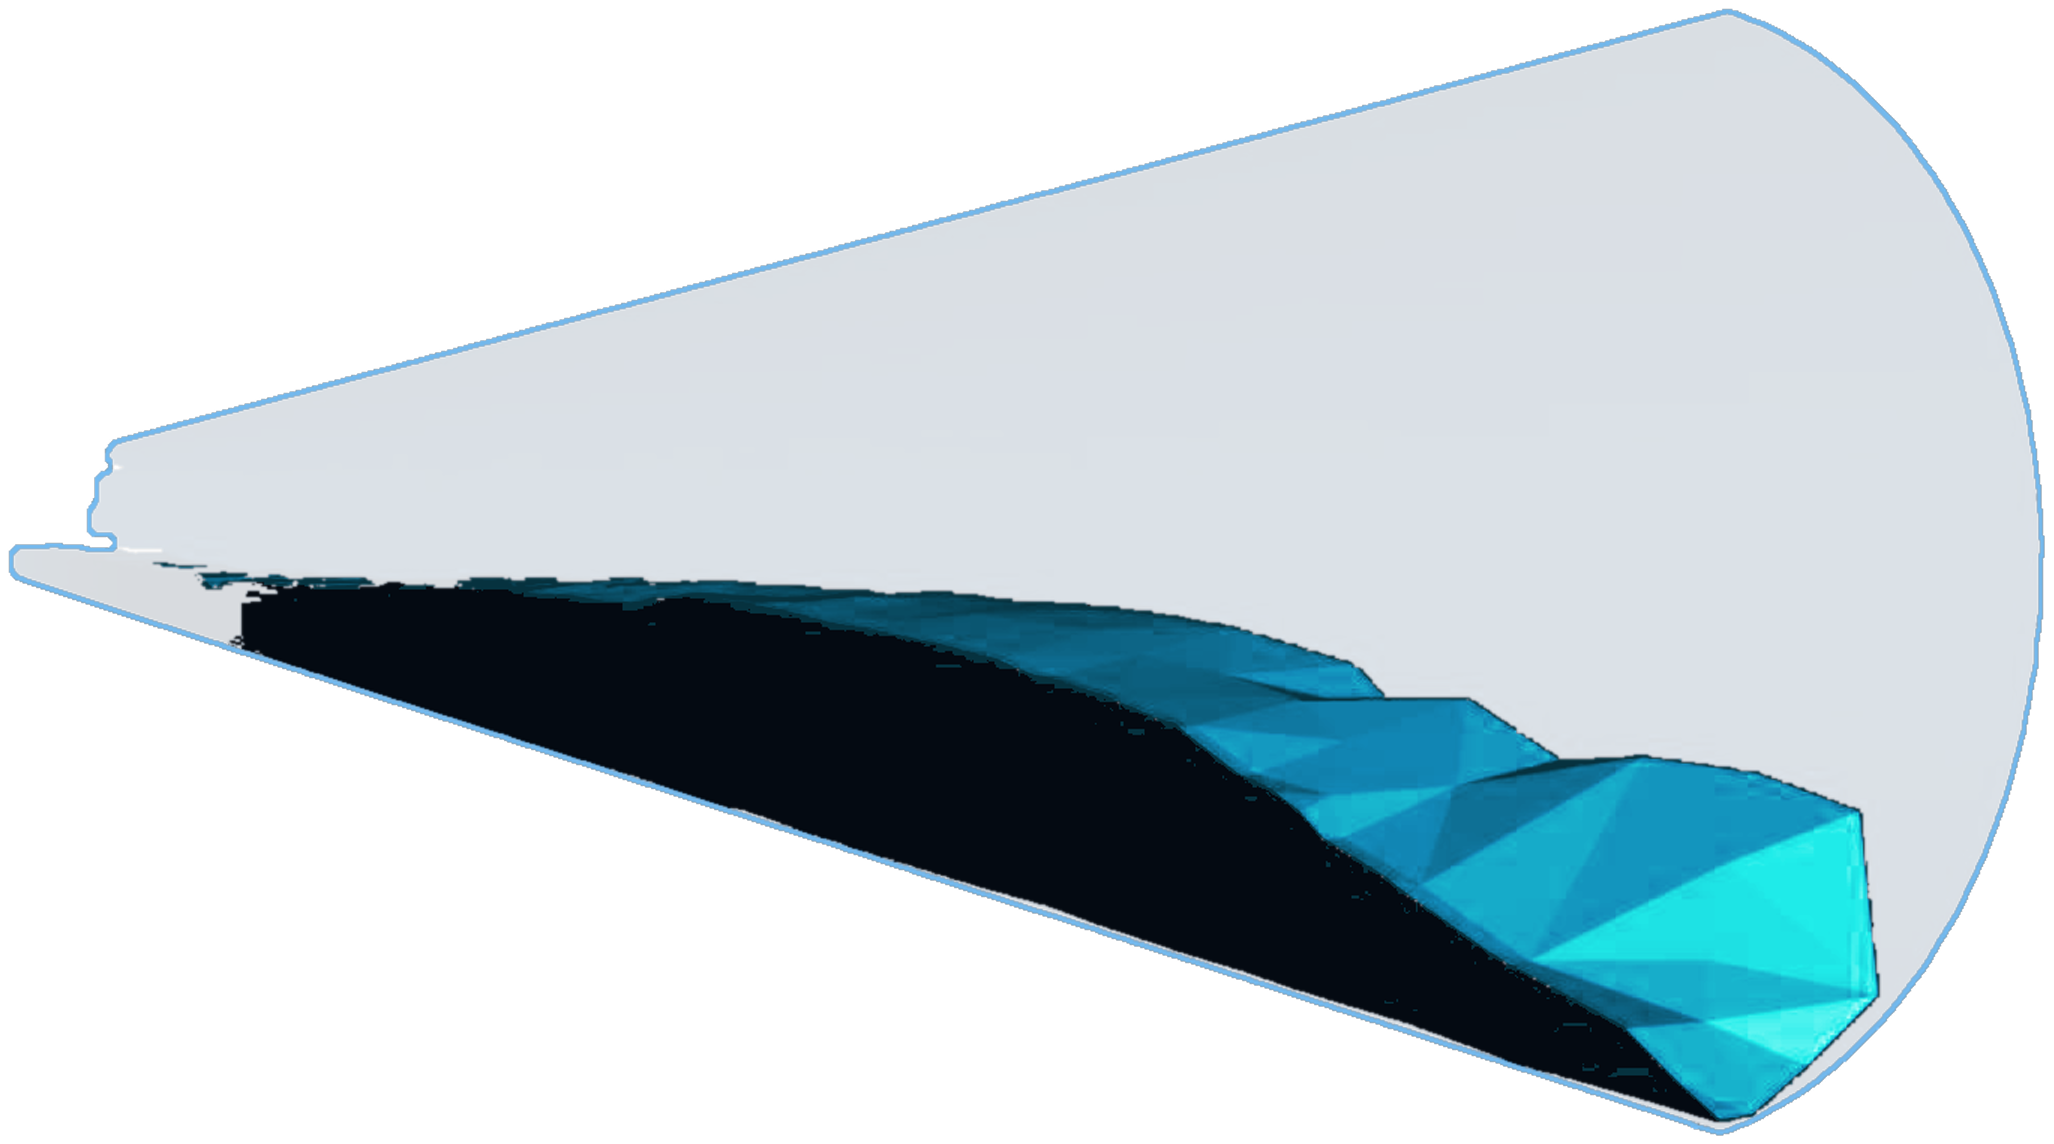
The owner received a report with processed 3D model imagery of the sediment along every stage, a volume table for each section, and visual imagery of the pipe crown where conditions allowed. The report was reviewed and signed off by industry-recognised engineering professionals, and the data can be used to plan clean-out works and to compare against future surveys.
Why It Matters
Guessing how much silt is in a drain leads to either wasted money or missed risk. A measured volume lets an asset owner scope and price a clean-out properly, target the worst sections first, and prove the result afterwards by surveying again. Because sonar is not stopped by poor visibility, the same approach works in drains, culverts and outfalls that no camera can see through.
Planning a similar inspection?
If you manage stormwater drains, outfalls or tunnels where visibility is poor, our team can measure what is inside them without anyone entering the pipe. Contact us to discuss your asset.
inspections@aus-rov.com.au | 0412 291 870 | https://www.aus-rov.com.au/contact-us